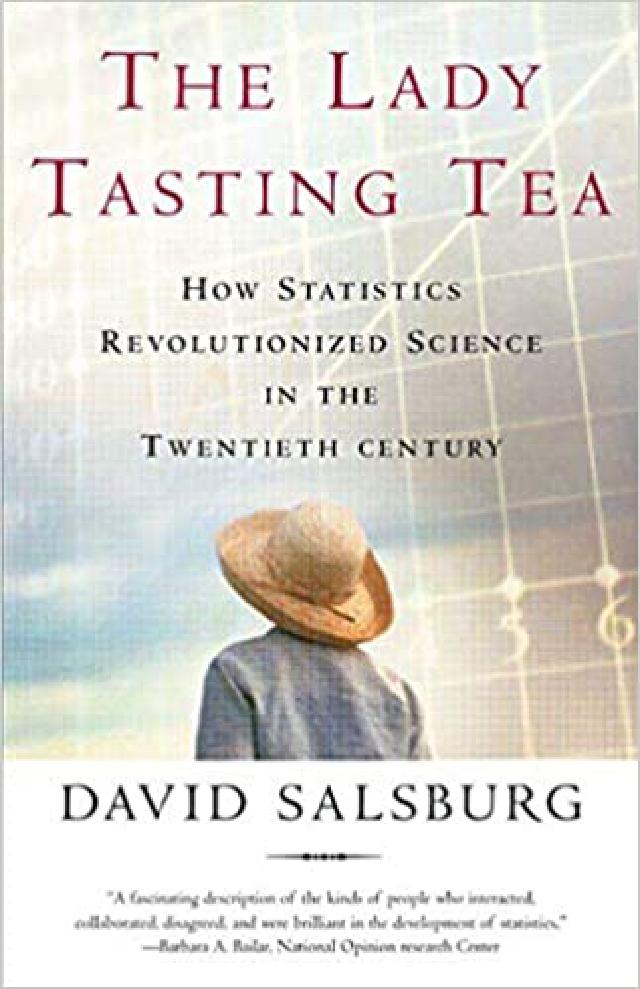
While Algebra and Calculus can leave students frustrated, Statistics is a different type of mathematics, and can be a refreshing change, especially when it is presented in a creative and compelling format.
This book by medical statistician David Salsburg, does just that. The book takes its title from the story of a summer tea party in Cambridge, England, where a woman stated she could tell the difference between tea poured into milk and milk poured into tea. Ronald Fisher, in attendance, proposes to scientifically test her claim.
This is a history book more than a math book. There isn’t a single formula, and the concepts are accessible to the nonmathematician. The statistical discussions are couched in biographies that describe the beginnings of the statistical revolution. Salsburg describes the personalities behind the numbers. He portrays the thrill of discovery as the questions in the field of statistics have been solved. He demonstrates the delight of collaboration across countries and continents through the interactions between the men and women and their original research as well as their ability to synthesize information.
Above all, Salsburg provides context for the discoveries. One mathematician, working in Communist Russia, found he couldn’t make progress with incorporating random variables into the experiments. “The Russian word for random variable translates as ‘accidental magnitude.’ To the central planners and theoreticians, this was an insult. All industrial and social activity in the Soviet Union was planned according to the theories of Marx and Lenin. Nothing could occur by accident. Accidental magnitudes might describe things observed in capitalist economies—not in Russia.”
One quote is particularly comforting:
“The most important theorems are often rediscovered, again and again.” This reminds me to keep trying, and to press forward through all the necessary repetition to understand a concept.
Reading this book kindles in me a greater desire to understand math and statistics. It makes me want to contribute to and understand more. After reading this book, I had a thirst for more information on the people and topics. For example:
Florence Nightingale wasn’t just a self-sacrificing nurse. She was also a self-educated statistician who invented the pie chart. Read more about her here
Salsburg quotes John Tukey,
“It is better to have an approximate answer to the right question than an exact answer to the wrong one.”
It was Tukey who coined the words bit (for “binary digit”) and software (computer programs, as opposed to “hardware”—the computer).
You might feel inspired to change the way you keep your tally marks . Tukey proposed a ten-mark tally. You first mark four dots to make the corners of a box. You then connect the dots with four lines, completing the box. Finally, you make two diagonal marks forming a cross within the box.
“Mathematical Recreations” column by Martin Gardner in Scientific American
H. E. Dudeney, whose mathematical puzzles entertained Victorian England
We read this book as part of our supplement to AP Statistics this year. You can find my tutorial for teaching AP Statistics here
This book is best for high school age and is a great introduction to the possibilities of the field of Statistics.